How I track Claude Code and Codex usage in real time
A practical look at local tools for tracking live usage, tokens, sessions, and history across Claude Code and Codex.
I want to see how much Claude Code or Codex I am using while I am using it. At the moment I have to open Claude settings or the equivalent Codex usage screen and check by hand. It is a pain.
I also want a record over time: usage by session, day, project, model, and ideally an estimated cost.
The short answer
I use OpenUsage for the live view. It runs locally and shows Claude Code and Codex usage, quotas, rate limits, tokens, spend, and burn rate in one place. It also keeps history in a local SQLite database.
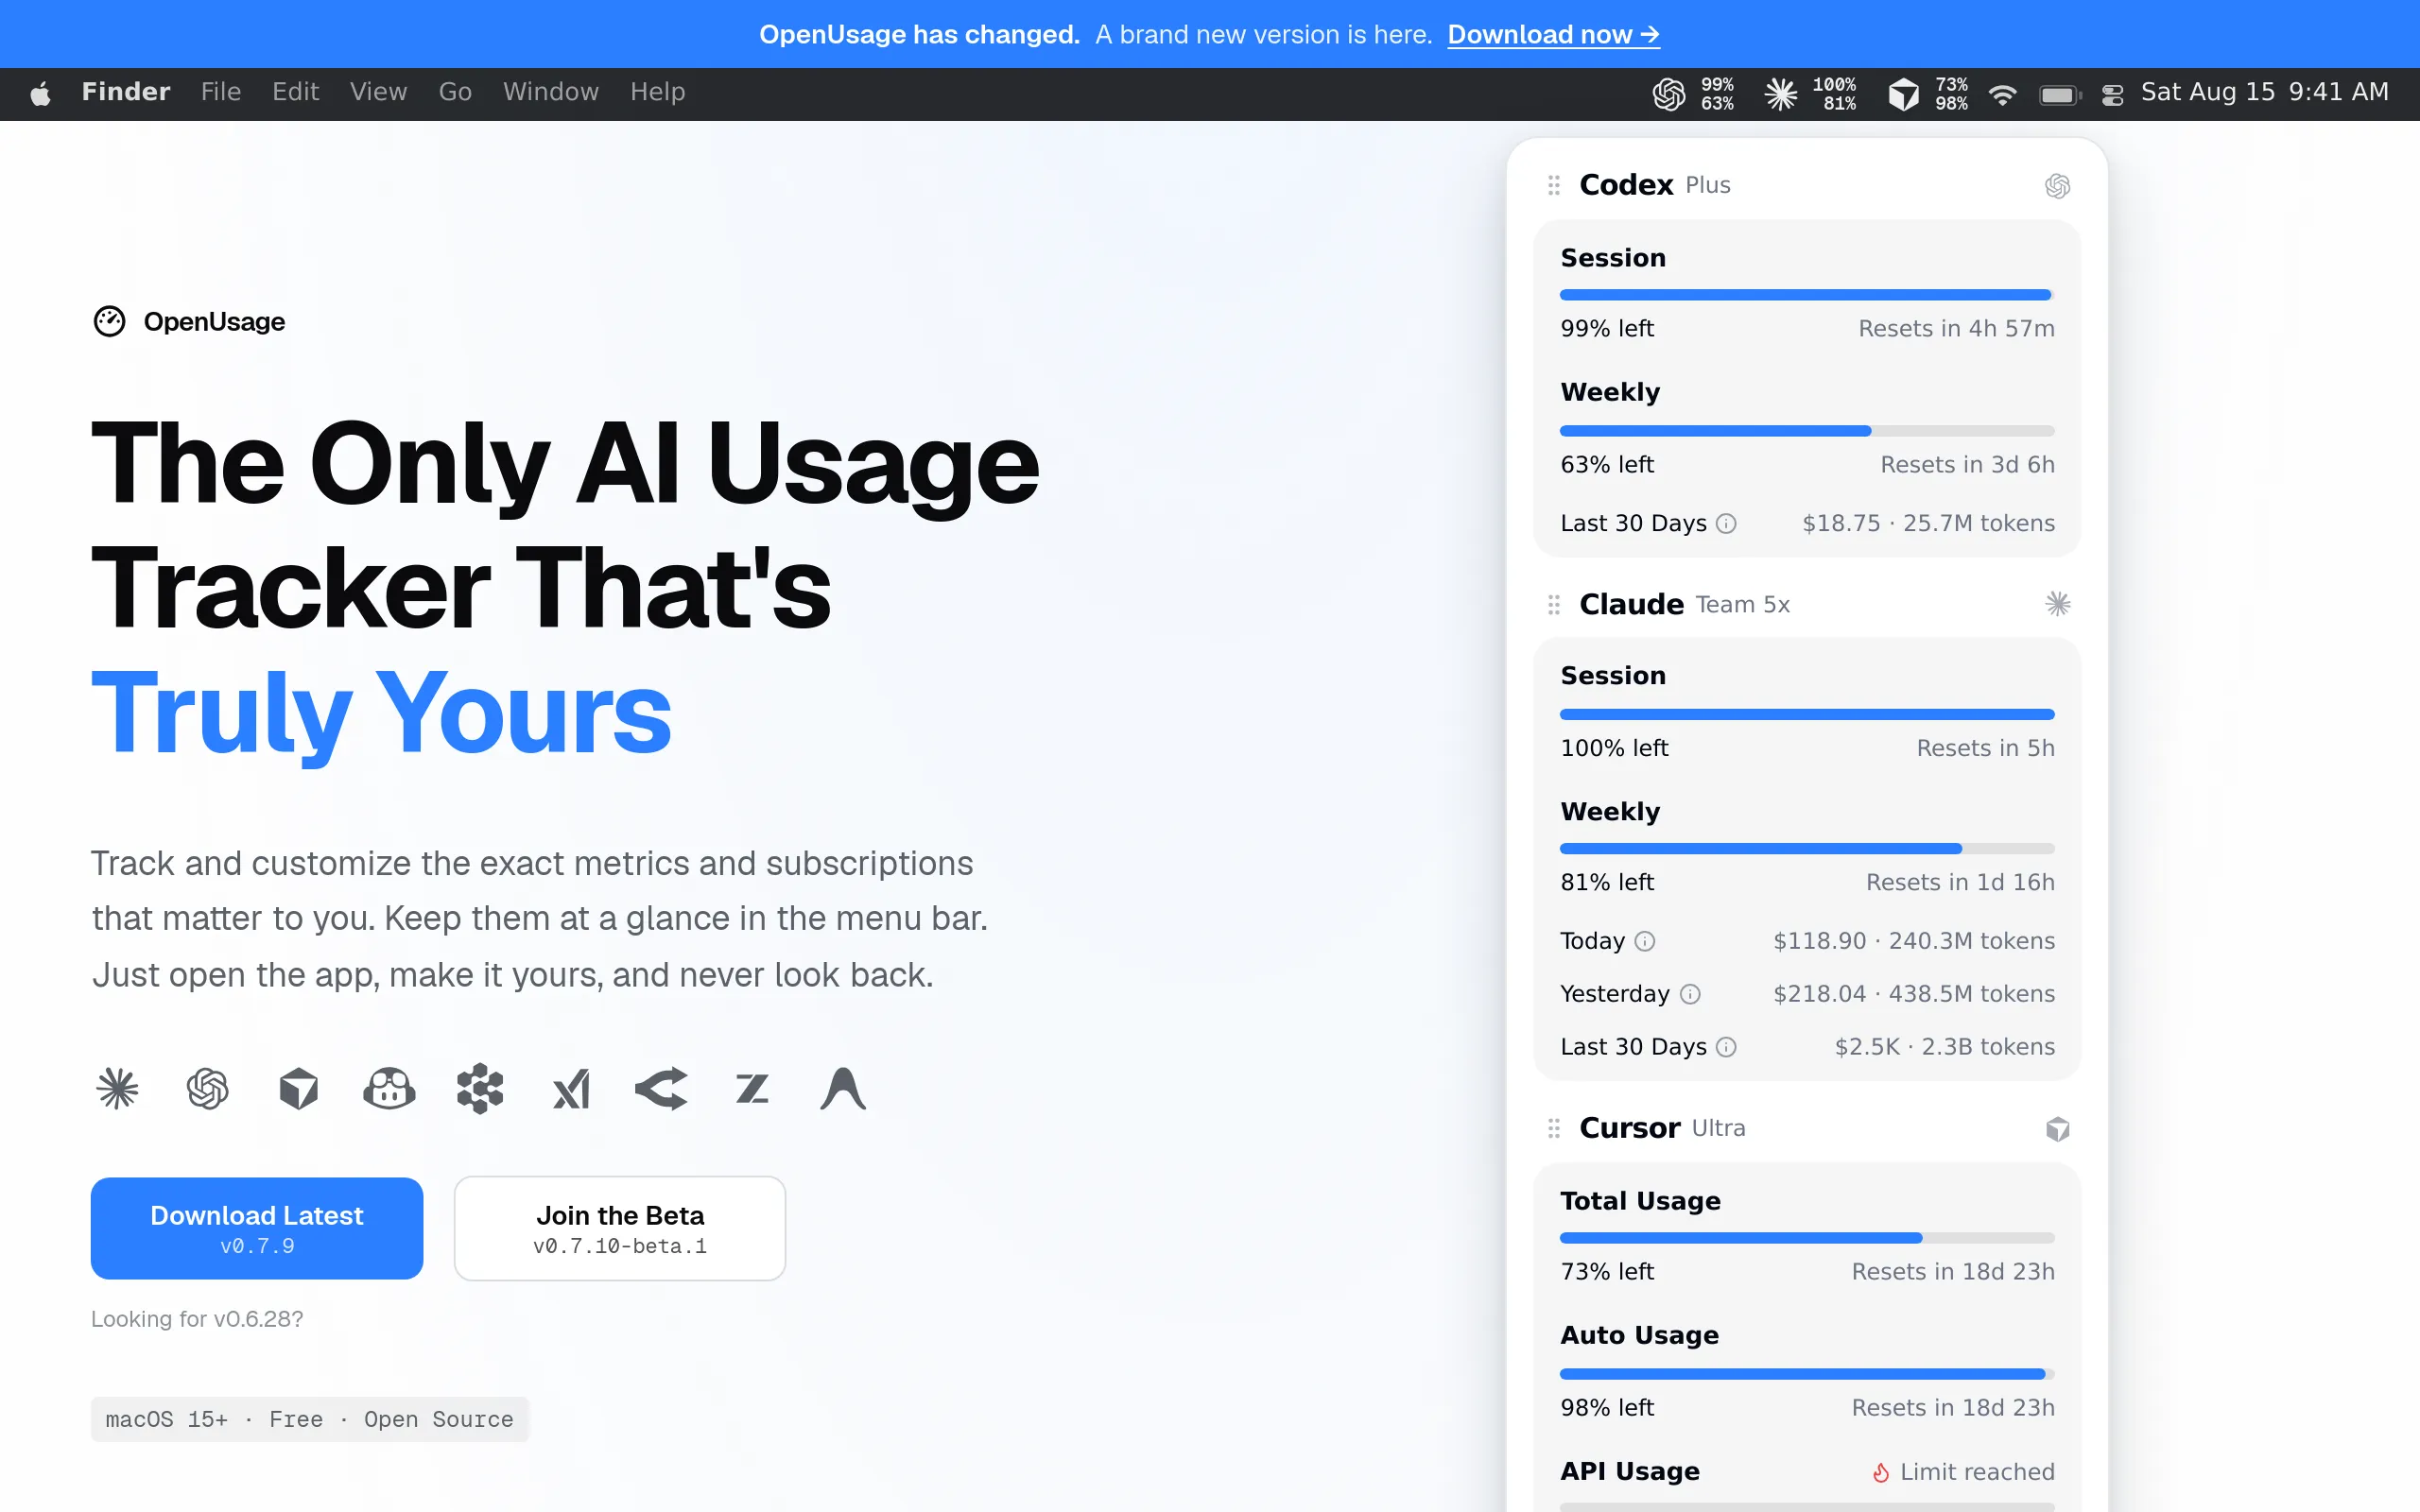
It is a small Mac app that sits in the menu bar. I have used it and it is fine. Most importantly, it removes the manual polling: I can see the current session and weekly allowance without opening settings.
I also use ccusage for simple historical reports. It is a command-line tool, easy to run without installing anything, and supports both Claude Code and Codex:
bunx ccusage daily
bunx ccusage weekly
bunx ccusage monthly
bunx ccusage session
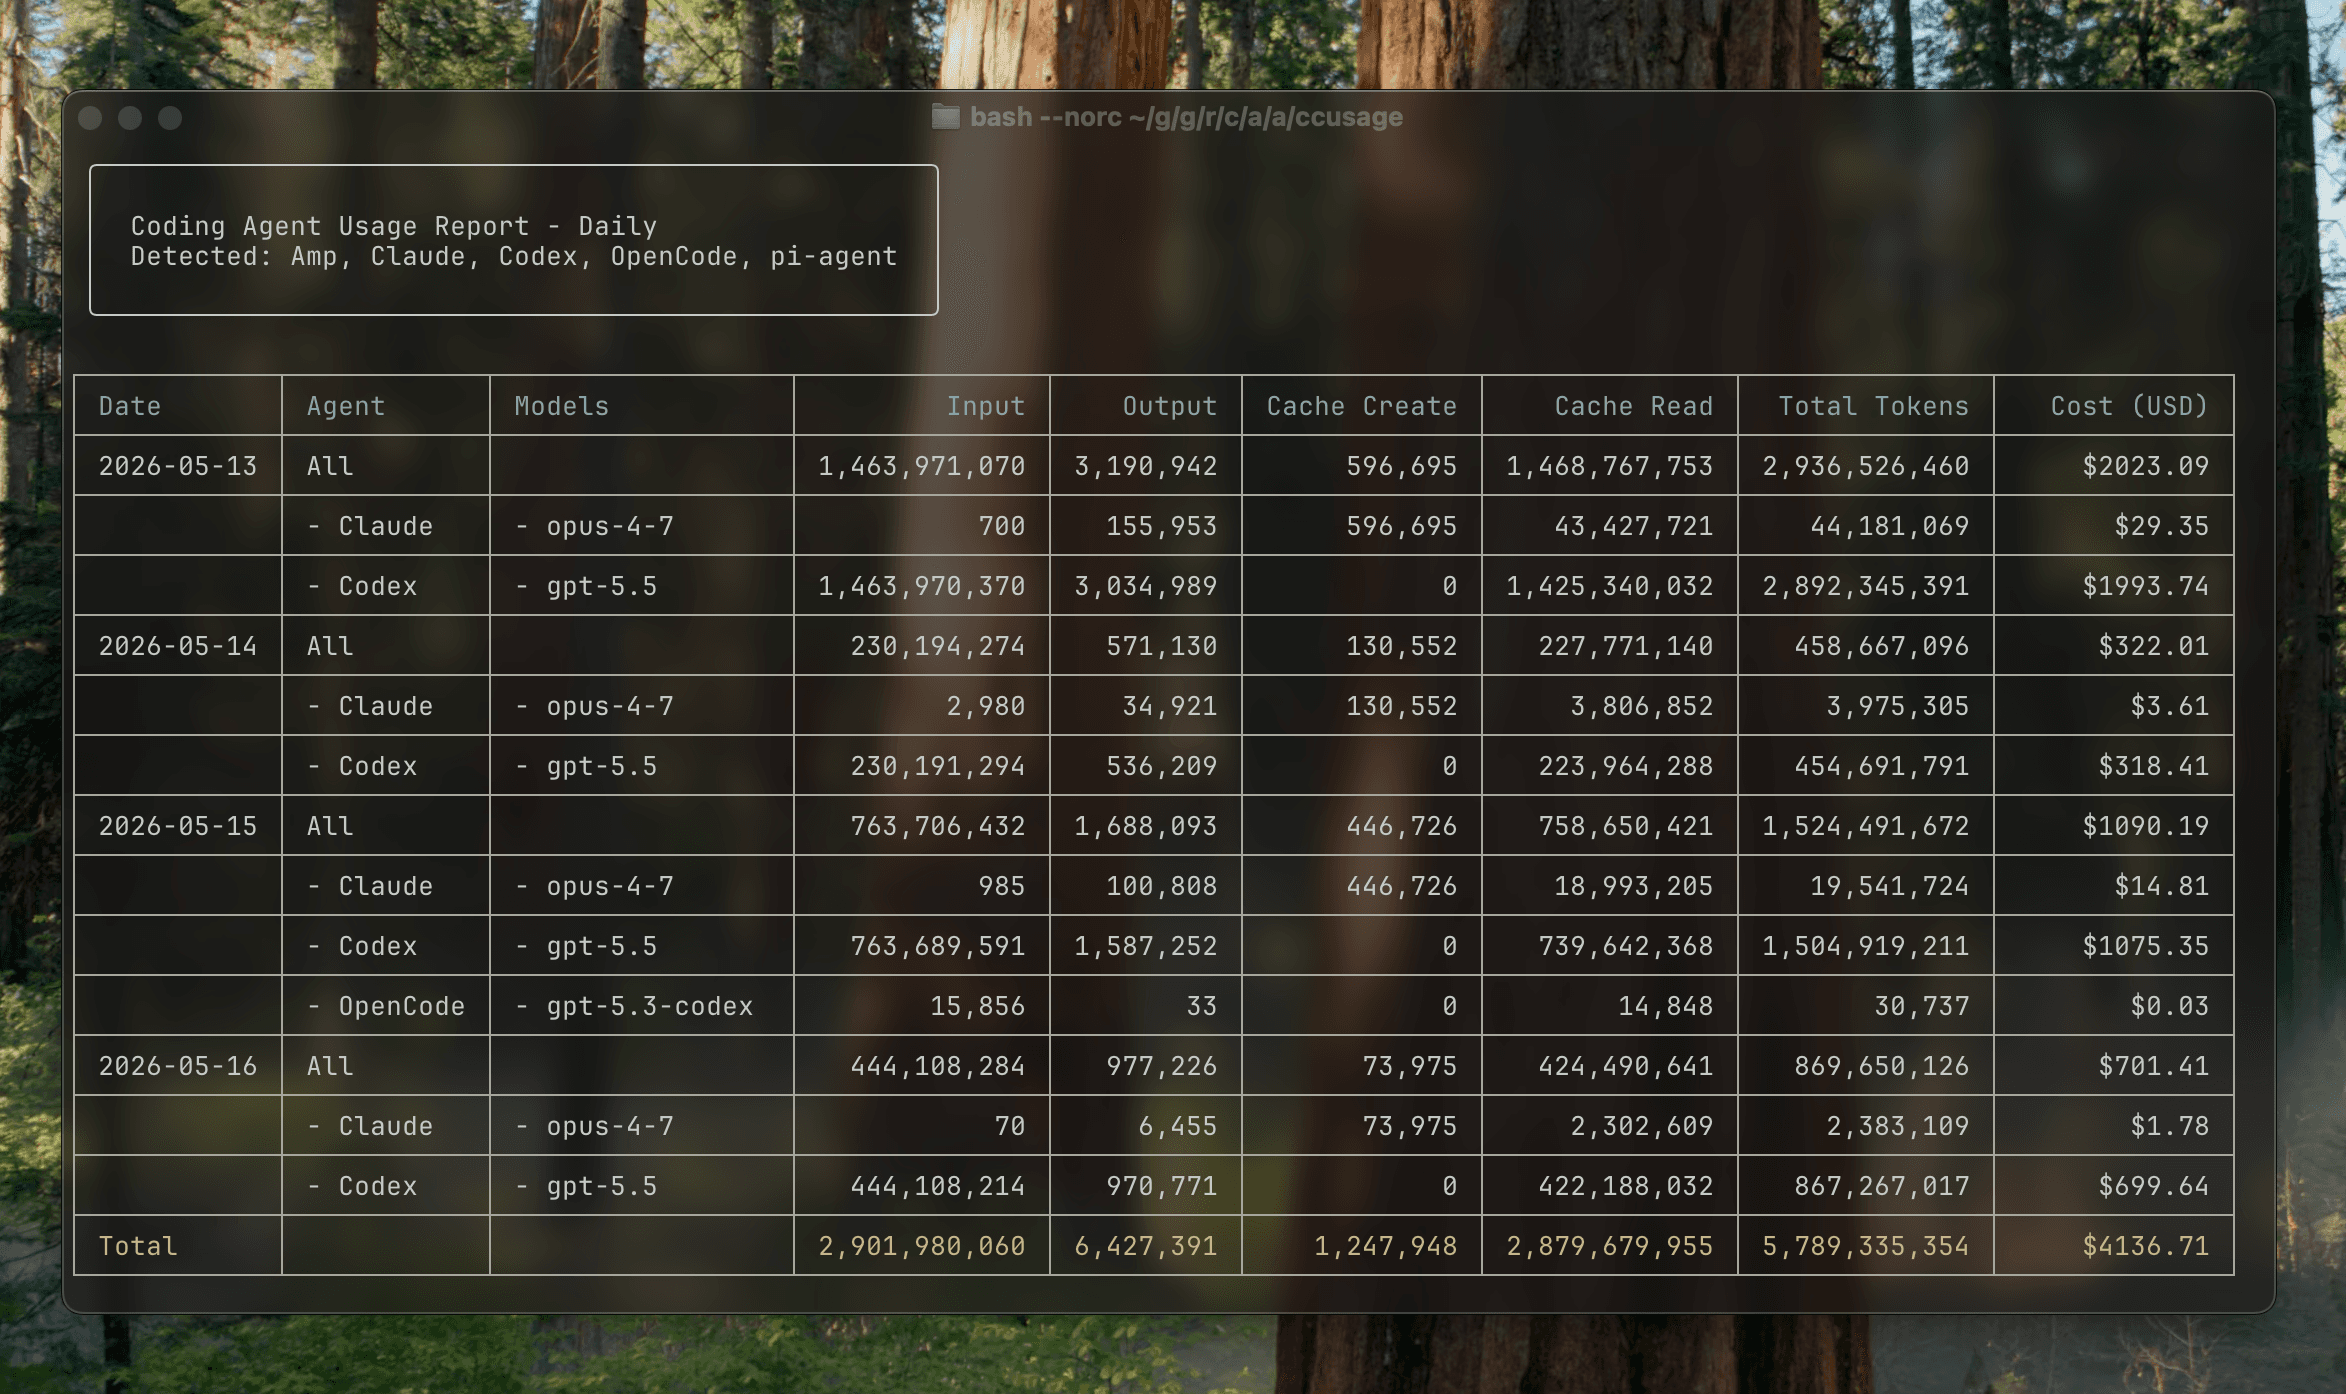
For one tool at a time:
bunx ccusage claude daily
bunx ccusage codex daily
bunx ccusage codex session
My current setup is:
- OpenUsage for the live view.
- ccusage for a quick report by day, month, or session.
- The built-in Claude and Codex usage pages when I need the provider's own quota information.
What the built-in tools give me
Claude Code has a useful /usage command. It shows the current session's token counts and an estimated cost, along with plan usage information for subscribers. Claude Code can also put usage information in its status line, so this is worth configuring even if I install another tool.
The limitation is that I have to remember to open /usage, or configure the status line myself. It is good for the current Claude session, but it is not a combined Claude-and-Codex history.
Codex has a usage page and limit information in its settings and interface. OpenAI describes Codex usage as part of a shared agentic usage or credit pool, where the amount consumed depends on the size and complexity of the task. Some Codex surfaces also show thread-level credit usage.
That is useful for knowing whether I am approaching a limit. It is not the same thing as having one local view of both agents running side by side.
Why ccusage is still useful
ccusage reads the local usage files that the coding CLIs already create. It does not send the data to a dashboard. It aggregates those files into daily, weekly, monthly, and session reports, and it can output JSON as well as tables.
That makes it a good fit for questions like:
- How much did I use yesterday?
- Which Claude Code session used the most tokens?
- How much Claude Code usage did I have compared with Codex this month?
- Which project is responsible for most of the usage?
The basic command is enough to try it:
bunx ccusage
It detects supported local agent data and shows a report. The project documents Claude Code data under ~/.claude/ and Codex data under ~/.codex/ by default. If either tool uses a custom data directory, the corresponding environment variable can be set before running the report.
The main thing to remember is that ccusage is an analysis of local files. Its cost figures are estimates based on token counts and model pricing. They are not the provider's invoice, and they may not exactly match the quota calculation used by Claude or OpenAI.
OpenUsage versus ccusage
These tools overlap, but they are aimed at different jobs.
| OpenUsage | ccusage | |
|---|---|---|
| Claude Code | Yes | Yes |
| Codex | Yes | Yes |
| Live monitoring | Main use case | More limited; mainly reports and Claude-specific blocks |
| Daily/monthly/session reports | Yes | Yes |
| Local data | Yes | Yes |
| Historical storage | Local SQLite database | Reads existing local session files |
| Interface | Local menu-bar app | Command line |
| Setup | More involved | Very small |
| Best for | One live view across tools | Simple, reproducible reports |
If I only used Claude Code, I would probably start with ccusage and Claude's status line. If I use Claude Code and Codex together and want a live screen, OpenUsage is the better fit.
Other options
There are several Claude-only monitors, including Claude-Code-Usage-Monitor, which focuses on live token usage, rate limits, and burn-rate prediction. That could be useful if the main problem is knowing how quickly a Claude Code five-hour window is being consumed.
There are also hosted team dashboards. I am less interested in those for this use case. I want the data on my machine, available at a glance, and I do not need an organisation-wide cost management product.
Claude Code's OpenTelemetry support is another route. It exports token and cost metrics that can be sent to Prometheus or another monitoring system. This is the right direction for a team or a custom dashboard, but it is more setup than I want for a personal usage meter.
What the numbers mean
A local parser can count the tokens written to local session files, but the provider may apply its own quota rules, caching, weighting, or shared-pool logic. So I want two things shown separately:
- Local token and session counts, which are useful for understanding what I did.
- Provider quota and rate-limit status, which is what tells me whether I am about to be stopped.
Those numbers should not be collapsed into one pretend-precise cost figure.
Verdict
OpenUsage gives me the live view across Claude Code and Codex. ccusage gives me the history and session reports.
The built-in Claude and Codex usage screens still matter. They are the authoritative places to check plan limits and provider-side usage. But having to poll them manually is exactly the part I want to get rid of.
The practical setup is therefore:
OpenUsage  = live local monitor
ccusage    = history and session reports
Provider   = authoritative quota and billing view
That is enough for me. I do not need another elaborate analytics product; I need the current numbers in front of me while the agent is working.
